Difference between revisions of "Scoring"
From zFairs Contest Management
| Line 93: | Line 93: | ||
|} | |} | ||
| + | The z-scores are values shown in the above table are bogus. | ||
: Some helpful articles for reading on better understanding z-score values: | : Some helpful articles for reading on better understanding z-score values: | ||
Revision as of 09:09, 10 June 2022
- Scoring each project takes much consideration and deliberation by each judge. Unfortunately making sense of that score afterwards and determining the best Project Scores can also take much consideration and deliberation. On this page we cover that in a little more detail so you have the information needed to make the best decisions possible.
- For each Project and Judging result you will have access to up to 4 different scores. These are the Average Score for the Project, the Adjusted Score, the Raw Score and the Z-Score. See below for clarification on each of the individual scoring types.
Contents
Average Score
- This score takes the average out of all scores for a given project and presents that as its value.
Adjusted Score
- This score is similar to a z-score but is calculated to output a score out of 100. It is a normalized score, the same as with the z-score, so that any one judge doesn't have more sway than other judges on the end average score for a given project.
Normalization
- This helps equalize how judges score
- All the scores from the judges that are part of the set of projects(sample) are gathered
- The average score of each judge is found
- We calculate the mean score given by the judges
- We then determine the standard deviation of the sample
- We calculate the z-score for each judge
- We then adjust each judge's scores by the [-1 * (z-score * standard deviation)]
- We then calculate the average score of each project
- The project with the highest average score is the winner
How a Judges Score is calculated
- Each Category is Weighted
- We sum the total possible value of a category
- We sum the total earned value of a category
- Each category is scored by: (total_earned/possible_value * category_weight)
- Total Score is the Sum of the category score
Raw Score
- This is the score as given by the judge(s) without any calculations or normalizations being applied.
z-Score
- This is a normalized score that takes into account all of the scores assigned by a given judge for a single round. It does this by taking each raw score it then normalizes them and returns a score based on the average and the standard deviation.
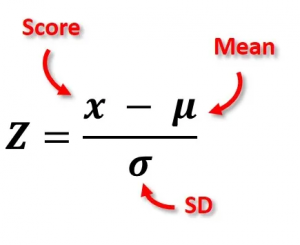
Formula
- z-score is equal to the raw score minus the population mean, divided by the population standard deviation.
- What that translates to for zFairs is:
- In a given round a judge assigns scores to projects. Those scores are evaluated and an Avg & SD (Standard Deviation) value are calculated. Those values are plugged in to the formula as seen above and each raw score from that judge is then normalized to a value representing how different from their standard score it is. Values that are negative are below the average score for the judge and values that are positive are above the judge's average score.
- The end result is that the z-score adjusts for the fact that some judges score higher in general whereas others score lower for the same effort and quality of project. Teams and Projects are then less affected by luck of the draw in regards to the judges they have assigned to judge them.
- An Example of this would be:
- Judge A judges 7 different projects and assigns the following scores out of 100: 87, 74, 91, 83, 77, 82 and 90
- Judge B judges the same 7 projects and assigns the following scores out of 100: 61, 59, 63, 70, 67, 54 and 67
- Judge C judges the same 7 projects and assigns the following scores out of 100: 44, 37, 45, 42, 39, 41 and 45
- The mean / average for Judge A is 83.43
- The mean / average for Judge B is 63
- The mean / average for Judge C is 41.86
- So for Judge A, B and C we calculate the z-scores as follows:
Avg=83.43
SD=6.399Avg=63
SD=30.333Avg=41.86
SD=9.476Project Judge A Judge B Judge C +0.56
-1.47
+5.49
-0.31
-4.66
-1.04
+4.76-1.63
-3.25
0.00
+5.69
+3.25
-7.32
+3.25+2.23
-5.06
+3.27
+0.15
-2.98
-0.90
+3.27
The z-scores are values shown in the above table are bogus.
- Some helpful articles for reading on better understanding z-score values:
